
Website graph visualization for seo
What this page covers
Website graph visualization for seo
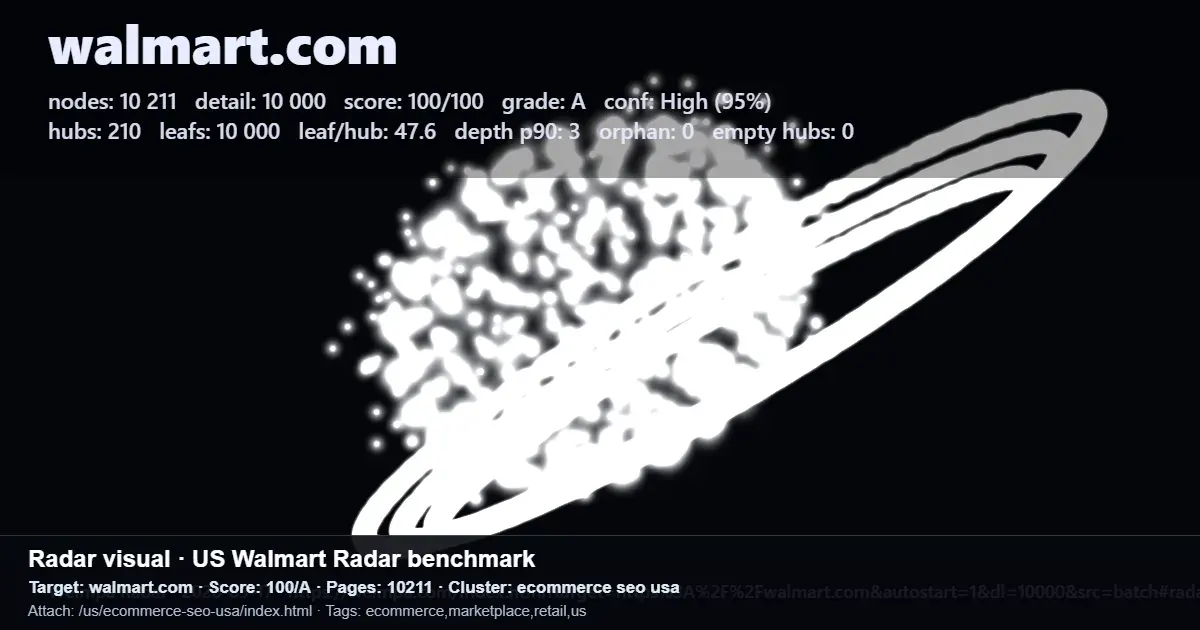
Website graph visualization for SEO shows your site as connected pages, internal links, hubs, and leaf pages instead of a flat URL list.
Use it during a website structure audit when you need a clearer view of crawl depth, link paths, and where important sections sit.
In brief
- It turns site structure into a visual model, making page relationships, hubs, leaves, depth, and internal linking patterns easier to review.
- It works best alongside a website architecture audit for SEO, crawler data, log analysis, and ongoing search visibility monitoring.
- It should guide practical structure decisions without replacing useful content, careful keyword use, or page-by-page SEO judgment.
What to do
A useful website graph visualization starts with structure you can verify: pages, internal links, hubs, leaf pages, crawl depth, and weak spots such as isolated pages or empty hubs. Radar-style reporting can show these signals with a readiness score so teams can scan the structure before deeper review.
The graph view is strongest when it works with technical SEO data. SEO crawlers can collect the page and link set, while log file analysis can add another layer for technical investigation. Monitoring search volatility also helps teams review structural changes more carefully during unstable periods.
Once the structure is visible, the next step is controlled SEO action. Good SEO guidance still favors natural, readable copy, careful keyword handling, and separate pages for distinct query groups. A graph can help organize pages, but it should not push teams into forced wording or low-value content.
What to keep in mind
Website graph visualization for SEO is not a standalone fix. It is a way to see relationships inside a website more clearly, especially internal links, hubs, leaves, depth, and weak entry points. The value of the insight depends on the quality of the crawl, audit, and supporting data.
It also does not replace a website architecture audit for SEO. Architecture review still requires judgment about page purpose, query grouping, content quality, indexability, and whether the structure matches how the site is meant to rank. The graph makes that review easier to discuss and prioritize.
Be careful with content changes that follow structural findings. SEO improvements should keep pages useful for readers, avoid awkward keyword insertion, and prevent over-optimization. Graph insights are best used to improve discovery, internal linking, and page organization.